myVectron Reporting app
my business in my pocket
With the myVectron reporting app, you always know how your business is doing. The mobile application's real-time data base gives you reliable impetus for quick reactions when needed and always keeps you up to date on the status quo of your business. The clearly structured dashboard reveals top products, top employees and peak times, allows sales forecasts, interval comparisons and the observation of many other parameters even across several subsidiaries. The mobile reporting app gives you more overview and control at any time and any place.
This module is included in the myVectron Standard package in several countries and can be booked additionally in combination with the myVectron Start package in several countries. Please check with your retailer.
Top FeaturesDaily sales
Check your daily or hourly turnover for the whole company or a specific subsidiary and compare the current values with data from reference days.
Turnover development
Use the detailed turnover chart on an hourly basis, for example for precise staff planning, and identify not only turnover peaks but also the weak turnover phases, the hourly average and the previous week's value.
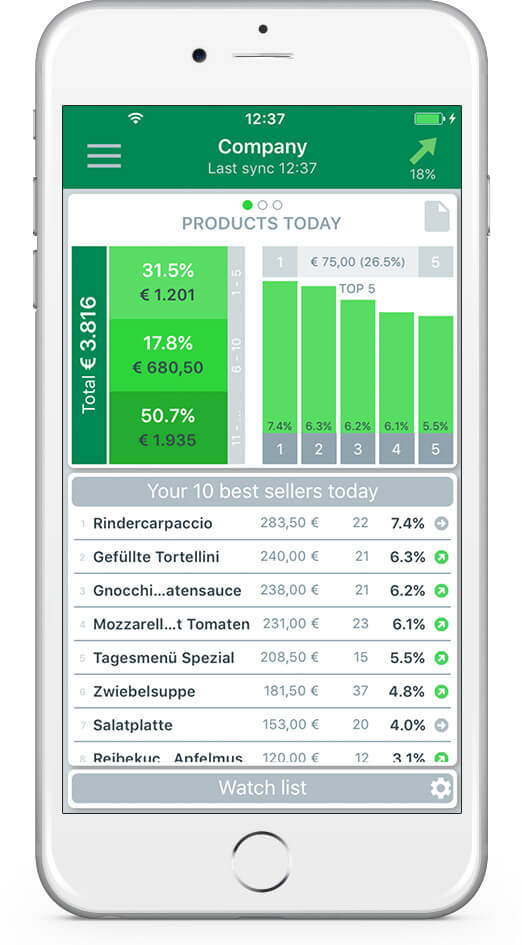
Top sellers
With the myVectron Reporting-App you recognise the bestsellers of each subsidiary or company-wide by units sold and their respective share of total turnover.
Historic data
Plan the future with a view to the past and look at your company's performance indicators over different periods and days.
Sales forecasts
The myVectron Reporting App graphically displays the trend along with the sales forecast and provides you with a valuable decision-making aid with real-time data from your POS system.
Charts and Analytics
In addition to the daily turnover, you can analyse many other parameters with the app using intuitive graphics. In this way, you can record correlations such as turnover per operator and countless other indicators at a glance.
Daily sales
Check your daily or hourly turnover for the whole company or a specific subsidiary and compare the current values with data from reference days.
Turnover development
Use the detailed turnover chart on an hourly basis, for example for precise staff planning, and identify not only turnover peaks but also the weak turnover phases, the hourly average and the previous week's value.
Top sellers
With the myVectron Reporting-App you recognise the bestsellers of each subsidiary or company-wide by units sold and their respective share of total turnover.
Historic data
Plan the future with a view to the past and look at your company's performance indicators over different periods and days.
Sales forecasts
The myVectron Reporting App graphically displays the trend along with the sales forecast and provides you with a valuable decision-making aid with real-time data from your POS system.
Charts and Analytics
In addition to the daily turnover, you can analyse many other parameters with the app using intuitive graphics. In this way, you can record correlations such as turnover per operator and countless other indicators at a glance.
The myVectron-App includes the following evaluations:
- Daily sales company-wide and branch-related, incl. values of the reference day
- Number of previous invoices / customers
- Sales forecasts, trends and extrapolations incl. graphics
- Sales development on hourly basis as chart plus display of best, worst and average hour incl. comparison to previous week
- Shop list: List of all branch shops with important key figures, current trend and expected total daily sales
- Number and performance of operators
- Company-wide TOP 10 of PLU sales by sales, count and percentage in total sales
- Sales difference between TOP 1 and TOP 5 product
- Display of bestseller product by branch
- User-defined watch list for 10 PLUs
- Open sales/GCs company-wide and branch-related
- Access to historic data with extensive filter options
Charts on branch shop basis:
- Daily sales
- Invoices
- Sales per operator
- Sales per invoice
- Sales ranking of all operators
- Sales ranking of all products
- Sales of one product per hour
The App provides default periods, i.e. current day/week/month/year and yesterday/previous week/previous month/previous year. Furthermore you can display the individual data of a selected day, week, month or year.
Test now. A free demo version of the compact reporting tool for iOS and Android devices is now available for download.
Interested? Contact us now.
Tel.: +49 251 2856150
(Mon - Fri, 9 a.m. to 5 p.m. CET)
Looking for advice directly on site? No problem. Contact our competent specialist dealers in your area.